Financial software infrastructure has progressed through three distinct architectural generations since the mid-2000s. Generation 1 (2005-2013) coupled stateful desktop C++ binaries and single-symbol synchronous OnTick() event loops directly to single-broker dealing servers, democratizing electronic liquidity access while isolating local scripts from cross-asset covariance and macro text. Generation 2 (2012-2022) migrated market rendering into browser HTML5 Canvas and WebGL scene graphs alongside crowd-authored indicator scripts and zero-commission mobile order tickets. While execution friction approached zero, large-scale empirical studies prove that open-loop push interfaces amplified attention-driven herding and turnover drag. Grounded in multi-agent systems engineering and Wiener-Åström feedback control theory, this paper specifies Generation 3 (2023-2026): specialized closed-loop decision intelligence. We formalize how 4CastMachine AI (four live market-reading engines) integrates with the 9-AI ForecastCity architecture, deterministic Shadow Variant counterfactuals, 3-tier bounded assistant guardrails, and clause-level journaling, culminating in an end-to-end live Silver (XAGUSD 4h) walkthrough.
1. Monolithic Client Terminals and Synchronous Single-Symbol Tick Loops
Between 2005 and 2013, prime-of-prime liquidity aggregation and electronic limit-order books reshaped global foreign exchange and retail over-the-counter derivatives (King, Osler, and Rime [6, 7]). Bid-ask spreads on major currency pairs compressed by nearly an order of magnitude, and retail traders gained instant electronic order transmission from home computers. Desktop client terminals, most notably MetaTrader 4 (released in 2005) and MetaTrader 5 (released in 2010), standardized this first architectural era through a stateful Win32 C++ binary maintaining persistent TCP sessions to a single broker's trade server.
Generation 1 solved the primary engineering bottleneck of its decade: deterministic retail market access and local rule scripting. Yet whenever a quantitative developer attached an automated Expert Advisor (EA) or custom indicator to a chart window, execution ran inside a tightly constrained, single-symbol synchronous event loop. Every incoming quote arrival ΔP(s)k on symbol s at tick timestamp tk triggered the following local state transition:
In Equation (1), x(s)k denotes the local ring-buffer memory bound exclusively to chart symbol s, Φlocal is the synchronous OnTick() update function executing on the client CPU thread, gθ is a fixed parameter vector θ tuned offline, and u(s)k dispatches a market or pending order of size q with static stop-loss and take-profit offsets directly to the broker server.
Equation (1) enforces strict epistemic isolation. Because x(s)k sees only ticks arriving on symbol s, the local script is structurally blind to cross-asset covariance shifts, nine-timeframe hierarchical constraints, and unstructured central-bank or macroeconomic text wires unfolding milliseconds earlier across correlated markets.
Trace a concrete operational failure of Equation (1) during a live US Consumer Price Index release at 13:30:00 UTC. Suppose an EURUSD 15m mean-reversion Expert Advisor observes a calm 9-pip pre-release range and holds parameter threshold θ instructing it to buy a 6-pip dip. At 13:30:01 UTC, US 2-year Treasury yields jump +18 basis points and Gold (XAUUSD) drops -1.4% within 350 milliseconds on institutional feeds. Blind to yields, Gold, and the CPI headline text, the isolated EURUSD ring buffer sees its first -6.5 pip tick and fires a long OrderSend right into a macro repricing cascade, suffering 4.2 pips of entry slippage and an immediate 35-pip stop-out seconds later.
Two additional architectural ceilings accompanied this runtime topology. First, local desktop Strategy Testers encouraged unconstrained genetic grid searches over historical bar files, cultivating severe in-sample parameter overfitting with zero live forward-versus-backtest drift telemetry. Second, the terminal's Account History tab recorded only a flat accounting ledger (ticket number, fill price, swap, and net dollar profit), remaining completely blind to what four-clause trading plan the human operator had promised to obey.
ForecastCity's independent quantitative R&D on pattern geometry and multi-timeframe forecasting began in 2007 squarely inside this first era, culminating in commercial launch to paying traders in May 2013. Crucially, Generation 3 intelligence does not force MetaTrader operators to abandon familiar broker execution pipes. Through ForecastFollow, heavy multi-modal cloud inference runs on dedicated servers and projects live 4CastMachine AI zones, Pivots, harmonic patterns, and Green Arrows natively onto MetaTrader 4 and MetaTrader 5 charts while streaming closed broker tickets back into cloud compliance auditing.
2. Cloud Scene Graphs, Social DSLs, and the Open-Loop Churn Paradox
Between 2012 and 2022, financial software underwent a sweeping front-end and brokerage unbundling. Cloud charting engines decoupled market visualization from desktop C++ binaries by streaming normalized multi-exchange OHLCV feeds over WebSockets into browser HTML5 Canvas and WebGL scene graphs. Simultaneously, domain-specific array scripting languages (exemplified by Pine Script, introduced in late 2013) allowed millions of users to publish over 100,000 custom trailing indicators, while mobile brokerages compressed explicit per-ticket equity and crypto commissions to zero.
From a pure infrastructure perspective, Generation 2 was a triumph: device friction vanished, charts loaded instantly on any browser, and order transmission became effortless. Economically, the broader algorithmic and AI trading software sector expanded toward a converged $24.27 billion global market (analyzed in our market sizing study), where AI-native decision systems now compound near 20% CAGR compared with 5% to 7% for commoditized charting utilities. Yet across tens of thousands of self-directed retail accounts, frictionless cloud charts and zero-commission mobile tickets failed to improve investor profitability, and in many cohorts actively worsened drawdowns.
To see why, formulate the realized multi-period log-wealth growth rate grealized of a self-directed account executing Ntrades annual round-turns inside an open-loop interface:
Unpacking Equation (2), μgross is the theoretical pre-friction drift of the trader's setups, Ntrades is annual turnover count, (cticket + cspread + cslip) sums explicit commissions plus implicit bid-ask spread and market-impact slippage per trade, ηherd(Spush) is adverse selection loss induced by high-salience push lists and social feeds Spush, and (1/2) σ2port is Itô variance drag on geometric compounding.
Eliminating explicit ticket commissions (cticket → 0) removed the natural economic brake on impulsive clicking while leaving implicit bid-ask spread and adverse-fill slippage (cspread + cslip) intact. Combined with collinear indicator scripts and real-time "Top Movers" push alerts (Spush), frictionless UIs multiplied trade frequency Ntrades and portfolio variance σ2port right at short-term liquidity exhaustion peaks.
Three landmark peer-reviewed empirical studies quantify the exact magnitude of each loss term in Equation (2). First, Barber and Odean [3] audited 66,465 household brokerage accounts and proved that the highest-turnover quintile (turning portfolios over more than 250% annually) underperformed market benchmarks by 6.5 percentage points per year. Walk through that compounding math on a $100,000 account over five years: compounding at +11.4% benchmark return grows capital to $171,560, whereas subtracting 6.5% annual turnover drag (+4.9% net) leaves $127,020, erasing $44,540 of terminal wealth through overconfident trade frequency alone. Second, Barber, Huang, Odean, and Schwarz [4] analyzed zero-commission mobile brokerage users and documented that high-salience "Top Movers" lists synchronized concentrated retail buying bursts followed by -4.7% average 20-day abnormal returns; committing 25% of account equity across just twelve attention-chasing episodes in a year bleeds roughly -13.2% of total capital. Third, Apesteguia, Oechssler, and Weidenholzer [1] proved in controlled economic experiments that social leaderboards and passive copy-trading interfaces inflate tail-risk seeking (σ2port) without transferring genuine analytical skill. Both Generation 1 and Generation 2 perfected order execution while stranding human operators inside an unassisted open-loop system.
3. Specialized 9-AI Multi-Agent Decomposition and Bounded Operator Autonomy
When large foundation models emerged in 2023, early financial prototypes attempted a monolithic shortcut: streaming raw OHLCV arrays, macro news feeds, strategy rules, and account ledgers into a single conversational language model or end-to-end reinforcement-learning network. In production financial environments, monolithic architectures fail across three hard engineering axes. First, autoregressive token transformers suffer geometric and arithmetic hallucination on continuous floating-point price series and lack calibrated multi-horizon error covariances. Second, mixing noisy tick fluctuations with sparse central-bank policy text inside one shared parameter matrix induces severe modality interference. Third, end-to-end black-box policies violate auditability and cannot guarantee strict operational safety boundaries.
Modern multi-agent systems theory (Wooldridge [10]) and recent peer-reviewed financial AI benchmarks confirm that decomposing complex market workflows into specialized, tool-grounded agents outperforms monolithic models. Yu et al.'s FinMem [12] demonstrated that separating layered short-, medium-, and long-horizon memory profiles substantially improves out-of-sample regime adaptation. Zhang et al.'s multimodal FinAgent at ACM SIGKDD 2024 [13] proved that coupling dedicated visual-numerical chart processors with text reflection modules and deterministic domain tools beats generalist baselines across diverse asset classes. Similarly, Xiao et al.'s TradingAgents [11] established that separating technical, sentiment, risk, and execution-review roles eliminates single-prompt confirmation bias.
ForecastCity, the all-in-one AI platform for traders (ecosystem overview), embodies Generation 3 by partitioning intelligence across 9 specialized trading AIs organized into two distinct functional groups (four market-reading engines and five trader-side systems) connected through deterministic verification and execution surfaces, as illustrated in Figure 1.
Maintaining strict architectural honesty requires distinguishing live production AIs from upcoming roadmap modules:
- Four Live Market-Reading Engines Inside 4CastMachine AI (Quad-AI): Forecast AI (multi-timeframe technical geometry), Sentiment AI (live news and macro NLP), Synergy AI (continuous dynamic regime weighting into the Unified Strategic Insight), and Navigator AI (prescriptive Buy/Sell Zones, Pivot invalidation, Profit/Reverse Zones, and Green/Dashed Arrows across
200+instruments and100,000+daily forecast updates). - Five Trader-Side Systems in the AI Trading Family: AI Trading Journal (live beta across paid plans, auditing closed trades clause-by-clause on the
Strategy checkcard); AI Trading Assistant (live beta launched November 2026, a multilingual voice and text workspace operator); AI Trading Academy (Phase 1 multi-asset curriculum live across 25 languages, with Phase 2 Socratic AI progression in development); alongside two in-development roadmap modules, AI Trading Coach (persistent longitudinal habit mentoring) and AI Trading Community (AI-facilitated symbol scenario rooms).
To prevent conversational hallucination or unauthorized capital risk, AI Trading Assistant is governed by a formal Partially Observable Markov Decision Process (POMDP) separation invariant. Let Wt denote workspace state, Ŷ4CM denote official 4CastMachine AI market forecasts, at ∈ 𝒜 = 𝒜read ⊔ 𝒜imm ⊔ 𝒜conf denote a tool call, and ht ∈ {0, 1} denote explicit human confirmation click:
Equation (3) enforces three deterministic safety guarantees simultaneously. First, ∂Ŷ4CM / ∂at = 0 ensures the language model never invents ad-hoc price forecasts, reading official Quad-AI state strictly via read-only tools. Second, 𝒜 ∩ 𝒜broker_order = ∅ guarantees the assistant submits zero live broker orders. Third, Tpolicy partitions every workspace tool into three explicit permission tiers:
Giving an unconstrained language model write access to live broker APIs invites catastrophic prompt-interpretation errors. Partitioning the action space 𝒜 into zero-mutation read queries, reversible UI immediate edits, and human-gated confirm mutations with a 10-minute Undo window captures 10x operational speedups, such as compiling an eight-parameter strategy or scanning 300 symbols in seconds, with zero unauthorized execution exposure.
Concretely, asking "What is the 4h Silver forecast?" invokes tier read (Wt+1 = Wt, zero mutation). Saying "Switch layout to 2 charts and add ATR" executes in tier immediate with an instant one-click Applied · Undo pill. Requesting "Build a pullback strategy from this zone, scan 300 symbols, or pause me for 30 minutes after two losses" triggers tier confirm: the assistant renders a structured preview card, mutates Wt only if ht = 1, and retains a live 10-minute Undo snapshot. Compare operational latency quantitatively: manually configuring a 300-symbol multi-condition watchlist scan, computing lot sizing for 0.75% equity risk across foreign-exchange pip values, and assembling an eight-parameter strategy takes roughly 14 to 18 minutes of repetitive UI clicks (during which cognitive fatigue creeps in). Delegating that configuration through Equation (3) compresses setup time under 25 seconds while preserving 100% human sign-off on state transitions.
4. Decomposing Behavioral Leakage and Closing the Epistemic Loop via Shadow Variants
Why do discretionary traders frequently lose money even when handed positive-expectancy entry zones and low-latency execution? Clinical psychophysiological studies provide direct evidence. Lo, Repin, and Steenbarger [8] measured real-time autonomic arousal (skin conductance, blood volume pulse, and heart rate) in live day-traders and documented heightened emotional reactivity during volatility spikes. Extending that clinical line across investment-bank desks, Fenton-O'Creevy et al. [5] showed that high-performing senior traders actively regulate emotional impulses through structured analytical feedback, whereas underperformers act out fear and loss aversion directly through premature profit-cutting, stop-loss widening, and post-loss revenge trades.
Control engineering (Wiener [9]; Åström and Murray [2]) explains why Generation 1 and Generation 2 platforms cannot cure this drift. Let πθ = (ϕentry, ϕSL, ϕTP, ϕmgmt) represent a trader's intended four-clause trading plan, and let dk represent endogenous emotional disturbance on trade k. In an open-loop terminal, only net realized trade return Rk(uactualk) is recorded, confounding market randomness with human rule violations. ForecastCity unmixes those two variables mathematically by running an untouched deterministic Shadow Variant πθ,shadow on the exact same live streaming ticks inside Virtual Accounts while scoring every real fill across all four clauses in AI Trading Journal:
In Equation (4), E[Rshadow(πθ)] is the cost-adjusted realized expectancy (after realistic broker spread, commission, and overnight swap) of the pure four-clause rule set πθ, ek,j is the clause compliance deviation on trade k for clause j, and ΔJbehavior is total human behavioral alpha leakage in R-multiples.
Without a parallel Shadow Variant, a trader who finishes fifty trades down -4.2 R cannot tell whether their strategy lacks market edge or their own discretionary overrides sabotaged a profitable system, so they discard working strategies and hop endlessly across new indicators. Equation (4) acts as a scientific differential amplifier, subtracting identical market path noise to expose exact human execution cost clause by clause.
Walk through a concrete 50-trade attribution audit at $200 risk per trade (1.0 R = $200), depicted visually in Figure 2. Suppose over two months of live trading, a trader's manually intervened account records a net loss of -$840 (-4.2 R total, or -0.084 R per trade). In any Generation 1 or Generation 2 terminal, that strategy looks broken. However, the parallel Shadow Variant executing pure πθ rules on identical live streaming quotes generated +18.0 R gross edge, paid -2.5 R (-$500) in spread and swap friction, and banked +$3,100 (+15.5 R net, or +0.310 R per trade), sealed in a tamper-evident SHA-256 hash chain. Computing Equation (4) reveals ΔJbehavior = -4.2 R - 15.5 R = -19.7 R (-$3,940 of pure behavioral leakage): -5.2 R from late FOMO entries outside zones (eentry), -6.0 R from widening stops twice during news spikes (eSL), -7.1 R from cutting +3.0 R winners manually at +0.5 R (eTP), and -1.4 R from skipped break-even moves (emgmt).
5. Unified Coordinate Handoff Across the Ecosystem on Live Silver (XAGUSD 4h)
The defining engineering advantage of a closed-loop multi-agent ecosystem is shared structural coordinates: every module speaks the exact same mathematical price levels rather than forcing the trader to copy numbers manually between disconnected apps. Figure 3 captures live Silver (XAGUSD 4h) inside 4CM-AI Charts with spot trading right at 48.833.
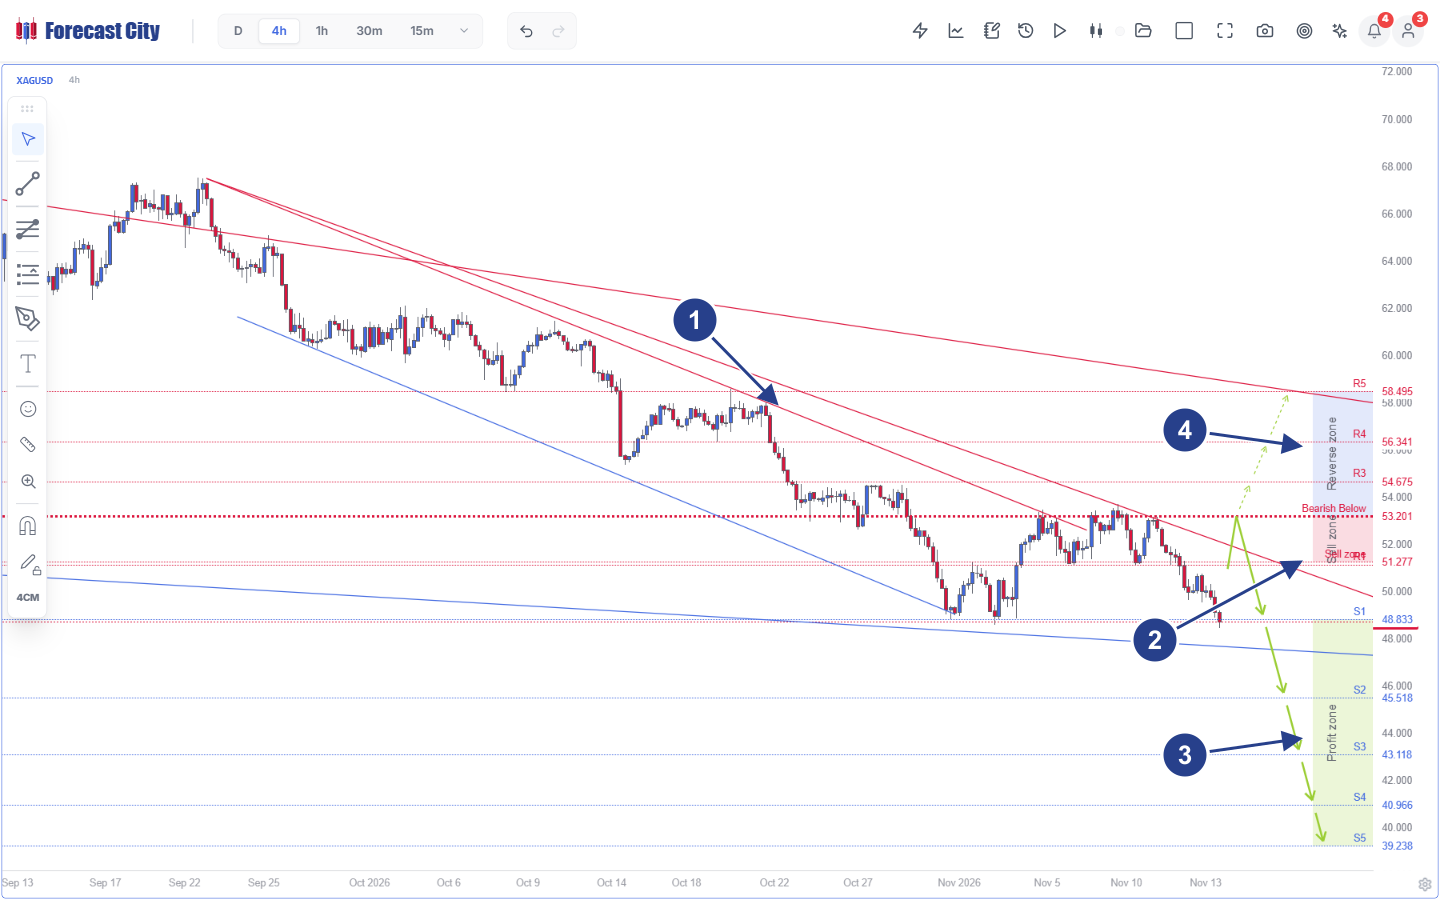
- 1Fan Trendline & Channel Structure: Triple descending red resistance fan lines radiating from the
67.50peak paired with the lower blue channel boundary. - 2Sell Zone & Falsifiable Pivot: Pink Sell zone spanning
R1(51.277) up to the horizontal redBearish Below 53.201Pivot invalidation line. - 3Primary Profit Zone Path: Solid Green Arrows projecting rejection from supply down through
S1(48.833, current spot),S2(45.518),S3(43.118),S4(40.966), andS5(39.238). - 4Contingency Reverse Zone: Blue-shaded Reverse zone above
53.201mapping conditional Dashed Arrows acrossR3(54.675),R4(56.341), andR5(58.495) toward outer fan resistance.
Follow this single Silver setup across all five operational stages of the closed loop:
- Multi-Scale State Estimation (
4CM-AI Charts+Quad-AI): On4h, Silver is bearish below53.201with short-term horizons aligned downward (15mbearish below48.940,30mbelow48.980,1hbelow51.167). However, checking higher-timeframe context reveals Daily (D) sits at the bottom of a wide48.440to71.368range while Weekly (W) and Monthly (M) hold macro structural support near49.810. With live spot atS1 = 48.833(just39.3cents above Daily range floor48.440), Navigator AI makes clear that shorting fresh size at48.833carries poor asymmetry compared with waiting either for a pullback into the51.277 - 53.201Sell zone or a confirmed breakdown below48.440towardS2 = 45.518andS3 = 43.118. Quantify thatR-multiple contrast directly: entering short on a pullback at51.800inside the pink Sell zone against structural invalidation atPivot = 53.201risks 1.401 USD per ounce to target 2.967 USD atS1 = 48.833(+2.12 R) and 6.282 USD atS2 = 45.518(+4.48 R), whereas chasing late at48.833against53.201risks 4.368 USD for just 3.315 USD toS2(0.76 R). - Formal Four-Clause Compilation & Counterfactual Testing (
AI Strategy Studio+Virtual Accounts): Inside AI Strategy Studio, the trader compiles those exact coordinates into four machine-verifiable clauses:Entryon bearish rejection inside51.277 - 53.201,Stop LossabovePivot = 53.201, stagedTake Profitexits acrossS1 = 48.833,S2 = 45.518, andS3 = 43.118, andManagementbreak-even shift onceS1fills. Deploying to a Virtual Account tests the rule set on live streaming Silver quotes with realistic spread and swap costs, runs a parallel Shadow Variant, and seals public results in aSHA-256hash chain. - Asynchronous Monitoring & Pre-Trade Guardrails (
Smart Alerts+AI Trading Assistant): Instead of staring at ticks, Smart Alerts monitor the51.277zone boundary 24/7. If the trader feels tempted to short impulsively at48.833and asks AI Trading Assistant "Am I in my plan on XAGUSD?", the assistant cross-checks live price against the compiled51.277 - 53.201entry clause and flags the out-of-zone FOMO violation before capital is risked. If two consecutive stop-outs occur, an automated loss-streak routine offers a 30-minute cooldown pause. - MetaTrader Execution Synchronization (
ForecastFollow): For traders routing live orders throughMetaTrader 4orMetaTrader 5, ForecastFollow overlays the exact51.277 - 53.201Sell zone,53.201Pivot, andS1 - S5ladder natively inside the broker terminal and syncs every fill automatically back to the cloud. - Post-Trade Clause Attribution (
AI Trading Journal): Once the Silver trade closes,Strategy checkevaluatesEntry,Stop Loss,Take Profit, andManagement(Followed,Partly followed, orNot followed), computesMAEandMFEcapture efficiency between51.800and45.518, and feeds objective compliance metrics directly back into the trader's next refinement cycle, laying the telemetry foundation for longitudinal mentoring in the upcoming AI Trading Coach.
6. Three-Generation Systems Architecture Matrix (2005-2026)
| Architecture Layer | Generation 1 (2005-2013) Client Terminals | Generation 2 (2012-2022) Cloud Charts & Zero-Fee Apps | Generation 3 (2023-2026) Multi-Agent Decision Stack |
|---|---|---|---|
| Runtime Topology | Win32 desktop binary coupled to single broker; synchronous OnTick(). |
Cloud OHLCV fan-out + WebGL canvas + vectorized script DSL. | Dedicated multi-engine AI cluster + native 4CM-AI Charts + ForecastFollow MT4/MT5 bridge. |
| Input Modalities | Single-symbol tick and bar history in local ring buffers. | Price/volume + 100,000+ collinear community indicator scripts. | Multi-scale OHLCV geometry (Forecast AI) + live news/macro NLP (Sentiment AI) via Synergy AI. |
| Analytical Output | Trailing indicator lines or brittle single-chart EA rules. | Descriptive oscillators & high-salience top-mover push lists. | Prescriptive chart flight plan: Zones, Pivot, TP1-TP5, Green/Dashed Arrows, DTO probabilities. |
| Strategy Verification | In-sample desktop parameter grid sweeps prone to snooping. | Static bar script tests; social copy-trading leaderboards [1]. | Cost-adjusted AI Strategy Studio + live Virtual Accounts + Shadow Variants + SHA-256 chain. |
| Control Topology | Open-Loop: flat P&L ledger blind to intended four-clause rules. | Open-Loop: zero-fee push alerts amplify herding churn (-4.7% 20d) [4]. | Closed-Loop Cybernetic Control: 3-tier Assistant guardrails + AI Trading Journal clause audit. |
Frequently Asked Questions
Why did Generation 2 cloud charting and zero-commission mobile apps fail to improve self-directed trader returns?
What are the 9 specialized trading AIs in the ForecastCity architecture, and what is the exact launch state of each?
Does AI Trading Assistant invent market opinions or submit live broker orders?
How does a Shadow Variant separate genuine strategy edge from human emotional execution errors?
Peer-Reviewed & Industry References
- [1]Apesteguia, J., Oechssler, J., & Weidenholzer, S. (2020). Copy trading. Management Science, 66(12), 5608-5622. https://doi.org/10.1287/mnsc.2019.3508
- [2]Åström, K. J., & Murray, R. M. (2021). Feedback Systems: An Introduction for Scientists and Engineers (2nd ed.). Princeton, NJ: Princeton University Press.
- [3]Barber, B. M., & Odean, T. (2000). Trading is hazardous to your wealth: The common stock investment performance of individual investors. The Journal of Finance, 55(2), 773-806. https://doi.org/10.1111/0022-1082.00226
- [4]Barber, B. M., Huang, X., Odean, T., & Schwarz, C. M. (2022). Attention-induced trading and returns: Evidence from Robinhood users. The Journal of Finance, 77(6), 3141-3190. https://doi.org/10.1111/jofi.13183
- [5]Fenton-O'Creevy, M., Soane, E., Nicholson, N., & Willman, P. (2011). Thinking, feeling and deciding: The influence of emotions on the decision making and performance of traders. Journal of Organizational Behavior, 32(8), 1044-1061. https://doi.org/10.1002/job.720
- [6]King, M. R., Osler, C. L., & Rime, D. (2012). Foreign exchange market structure, players and evolution. In Handbook of Exchange Rates (pp. 1-44). John Wiley & Sons. DOI
- [7]King, M. R., Osler, C. L., & Rime, D. (2013). The market microstructure approach to foreign exchange: Looking back and looking forward. Journal of International Money and Finance, 38, 95-119. https://doi.org/10.1016/j.jimonfin.2013.05.004
- [8]Lo, A. W., Repin, D. V., & Steenbarger, B. N. (2005). Fear and greed in financial markets: A clinical study of day-traders. American Economic Review, 95(2), 352-359. https://doi.org/10.1257/000282805774669704
- [9]Wiener, N. (1948). Cybernetics: Or Control and Communication in the Animal and the Machine. Cambridge, MA: MIT Press.
- [10]Wooldridge, M. (2009). An Introduction to MultiAgent Systems (2nd ed.). Chichester, UK: John Wiley & Sons.
- [11]Xiao, Y., Sun, E., Luo, D., & Wang, W. (2024). TradingAgents: Multi-agents LLM financial trading framework. arXiv preprint arXiv:2412.20138.
- [12]Yu, Y., et al. (2024). FinMem: A performance-enhanced LLM trading agent with layered memory and character design. Proceedings of the AAAI Symposium Series, 3(1), 595-597 (arXiv:2311.13743).
- [13]Zhang, W., et al. (2024). A multimodal foundation agent for financial trading: Tool-augmented, diversified, and generalist (FinAgent). Proceedings of the 30th ACM SIGKDD Conference on Knowledge Discovery and Data Mining (KDD 2024), 4314-4325. https://doi.org/10.1145/3637528.3671801