Across retail social feeds on YouTube, Instagram, TikTok, and X, a viral wave of content creators prompts conversational Large Language Models (LLMs) and multimodal Vision-Language Models (VLMs) such as ChatGPT, Claude, Gemini, and DeepSeek to forecast Bitcoin, Gold, and foreign-exchange trajectories. Because post-trained language models produce syntactically polished, institutional-sounding narratives, non-specialist audiences routinely mistake rhetorical fluency for quantitative edge. Drawing on theoretical computer science and empirical machine-learning benchmarks from STOC, NeurIPS, ICLR, AAAI, and The Journal of Finance, this paper proves why autoregressive generative models are structurally unfit for numerical market forecasting. We formalize five failure mechanisms: (1) loss of Euclidean metric continuity under subword digit tokenization, (2) lossy spatial-to-lexical patch projection when multimodal VLMs inspect candlestick images, (3) run-to-run output divergence across repeated queries even at zero temperature alongside Good-Turing lower bounds on inevitable hallucination, (4) RLHF sycophancy and persuasive sophistry compounded by pretraining look-ahead memorization in historical backtests, and (5) catastrophic calibration failure under capital risk. Finally, we specify the strict architectural boundary inside 4CastMachine AI: confining contextual language models inside Sentiment AI to encode unstructured news polarity and historical event similarity, while delegating all continuous price geometry, regime weighting, and chart roadmaps to Forecast AI, Synergy AI, and Navigator AI.
1. The Viral Category Error and the Eloquent Journalist Fallacy
Over the past three years, conversational Large Language Models (LLMs) have achieved remarkable fluency across natural-language drafting, code synthesis, and document summarization. That linguistic capability has triggered a widespread methodological error across retail financial media. Every day on YouTube, Instagram, TikTok, and X, high-reach content creators paste OHLC tables or upload candlestick screenshots into general-purpose chat models and broadcast the generated price targets to millions of viewers.
To an untrained viewer, the output looks authoritative. Within seconds, the language model names macro catalysts, cites familiar chart formations such as rising wedges or Fibonacci retracements, and writes a polished paragraph projecting where Bitcoin (BTCUSD) or Gold (XAUUSD) will trade next week. When prompted to adopt the tone of a senior institutional strategist, the model mirrors institutional vocabulary with complete grammatical confidence.
Beneath that linguistic polish lies a fundamental category error in applied mathematics. Financial markets are continuous-valued, non-stationary, low-signal-to-noise stochastic systems governed by limit-order-book clearing, heteroskedastic volatility, and fat-tailed jump processes. Autoregressive language models, by contrast, are discrete sequence generators trained to estimate which word piece is most likely to follow a string of prior word pieces in human text corpora.
A concrete structural analogy clarifies why these two mathematical domains cannot be swapped. Asking a generative LLM to solve a live multi-horizon market trajectory is equivalent to asking an eloquent newspaper journalist to solve a coupled system of nonlinear stochastic differential equations under real-time capital risk. A skilled journalist can write a captivating thousand-word essay about the history of calculus, quote famous mathematicians, and format the prose so cleanly that a lay reader assumes the equations were solved.
Yet prose fluency does not execute numerical integration. Worse, because generative decoding samples from flattened probability distributions and suffers from non-vanishing hallucination rates, that narrator behaves under stress like an intoxicated journalist who never admits uncertainty. Ask the exact same question twice, and the narrator may reverse direction without warning. Ask the exact same question one hundred times, and several responses will invent non-existent support levels or miscalculate elementary arithmetic while maintaining identical rhetorical poise.
To formalize this mismatch rigorously, we compare the optimization objective of an autoregressive language model against the optimization objective of a calibrated quantitative forecasting engine. Before writing the equations, notice what each loss function rewards and punishes during training. A language model minimizes lexical surprise over discrete token IDs, whereas a quantitative state-space engine minimizes metric distance and probability miscalibration over continuous real-valued price outcomes.
Let 𝒱 denote a finite subword vocabulary of size |𝒱| ≈ 32,000..200,000, and let v1:K ∈ 𝒱K denote a tokenized text sequence. An autoregressive LLM with parameters θ minimizes discrete token cross-entropy ℒLLM(θ). By contrast, let 𝐗t-L:t ∈ ℝL×d denote a real-valued market state tensor and Pt+τ ∈ ℝ+ denote future price at horizon τ. A quantitative engine with parameters ψ outputs a cumulative distribution Fψ(y | 𝐗t-L:t) that minimizes the Continuous Ranked Probability Score (CRPS, Gneiting and Raftery [16]):
In Equation (1), ℒLLM(θ) evaluates a categorical one-hot indicator on vocabulary index vk: every wrong token incurs the exact same negative log-likelihood penalty regardless of numerical magnitude. Conversely, CRPS(Fψ, Pt+τ) integrates squared cumulative probability error across the real line ℝ, strictly penalizing both metric distance from the realized price Pt+τ and uncalibrated dispersion.
Suppose Bitcoin trades at 64,570 and the true fair value tomorrow is 65,000. Under discrete token cross-entropy ℒLLM, outputting the string "64,999" (off by $1) can incur a higher token loss than outputting "95,000" (off by $30,000) whenever "95"+",000" shares high-frequency corporate text bigrams! Under continuous CRPS, a $30,000 error is penalized thirty thousand times more severely in expectation than a $1 error, anchoring every parameter update to real financial risk.
Empirical benchmarks confirm that training on trillions of words does not grant time-series forecasting skill. In a landmark NeurIPS 2024 Spotlight study, Tan, Merrill, Gupta, Althoff, and Hartvigsen [1] audited prominent LLM-based time-series architectures including Time-LLM, OneFitsAll (GPT4TS), and CALF across standard forecasting suites. The authors performed systematic ablations that deleted the pretrained LLM weights entirely or replaced the multi-billion-parameter language backbone with a single lightweight attention or linear patching layer trained from scratch.
The result dismantled the core premise of LLM forecasting. Removing the language model backbone caused zero degradation in forecasting accuracy and frequently improved Mean Squared Error (MSE) and Mean Absolute Error (MAE), while reducing parameter count and inference compute by two to three orders of magnitude [1]. Even in few-shot regimes where proponents claimed linguistic pretraining transfers sequential reasoning, pretrained LLM weights offered no measurable gain over tiny numerical encoders. Earlier work by Zeng, Chen, Zhang, and Xu at AAAI [15] similarly showed that simple direct linear mappings outperform complex sequential transformers when temporal order and scale are distorted by token projection.
2. Subword Tokenization Metric Collapse and Why Multimodal Chart Vision Sees Gestalt Waves Without Measuring Risk
To understand why scaling an LLM from seven billion parameters to over one trillion parameters never turns it into a reliable quantitative engine, we must examine what happens to raw market numbers at the very first layer of the network. Quantitative algorithms ingest prices, volumes, and volatility series as IEEE-754 64-bit floating-point numbers. Real numbers form a complete metric field: addition, multiplication, ordering, and Euclidean distance are exact hardware primitives.
Language models do not ingest floating-point scalars. Before a transformer sees a single price, a Byte-Pair Encoding (BPE) or SentencePiece tokenizer slices the raw character string into variable-length subword chunks based on corpus compression frequency. Singh and Strouse [5] demonstrated that frontier LLMs split multi-digit numbers into inconsistent 1-digit, 2-digit, or 3-digit tokens from left to right, directly colliding with right-to-left positional arithmetic and place-value carry logic.
Consider what BPE tokenization does to live foreign-exchange and cryptocurrency quotes. On EURUSD, the prices 1.0849 and 1.0850 sit exactly 0.0001 (1 pip) apart, representing virtually identical market states. Under subword tokenization, "0849" and "0850" map to distinct integer IDs whose initial token embedding vectors in ℝde need not sit any closer than the token for "1.9850" (9,000 pips away!). We formalize this topological rupture through the local metric distortion ratio of the tokenizer map.
In Equation (2), x, y ∈ ℝ are two real market prices separated by one minimum tick δ, str(·) converts the scalar into decimal characters, and ΦBPE(·) maps the resulting subword sequence into pooled input embedding space. In a smooth quantitative model, κ(x, y) is bounded by a finite Lipschitz constant so tiny price shifts induce tiny state perturbations. Under BPE string chunking, κtok(x, y) jumps erratically at digit-carry boundaries such as 69,999.99 to 70,000.00 while collapsing artificially whenever distant prices share trailing substrings.
Equation (2) explains why LLMs fail elementary risk calculations on live charts. To a subword tokenizer, 67,248 and 57,248 look nearly identical because four of their five digits match, even though they sit $10,000 apart on Bitcoin! Meanwhile, 69,999 and 70,001 share zero digits after the decimal point despite sitting just $2 apart. No quantitative volatility or stop-loss engine can operate reliably when its input coordinate system scrambles numerical distance.
This representation flaw cascades into multi-step calculation failure. Dziri et al. at NeurIPS [6] proved that autoregressive transformers tackle multi-step arithmetic and dynamic programming by linearized subgraph pattern-matching rather than learning generalizable algorithms, causing accuracy to decay exponentially as compositional depth grows. At Apple Machine Learning Research, Mirzadeh et al. [7] introduced GSM-Symbolic, replacing static benchmark constants with symbolic numerical variations. Merely changing the specific numbers in a math problem caused significant accuracy swings across frontier LLMs, and inserting a single irrelevant contextual clause collapsed reasoning accuracy by up to 65% [7]. Financial markets inject dozens of noisy, irrelevant macro clauses every hour.
Faced with text-tokenization limits, social-media traders often pivot to a second claim: "Instead of typing numbers, upload a screenshot of the candlestick chart so a multimodal Vision-Language Model (VLM) can read the waves visually just like an experienced human chartist!" At surface level, this sounds plausible. When a human looks at a price chart, the visual cortex spots alternating peaks, troughs, and diagonal trend contours instantly. Multimodal VLMs indeed mimic that casual human glance, naming apparent waves, triangles, or head-and-shoulders silhouettes in fluent prose.
Yet seeing the qualitative shape of a wave is completely different from computing quantitative conditional expectancy. When a multimodal VLM ingests a 1440×900 chart screenshot, a Vision Transformer encoder (ViT or SigLIP) dices the image into coarse 14×14 or 16×16 pixel patches and projects those visual patches through a lossy linear adapter into the language model's word-embedding space. Sub-pixel wick extremes, exact open-to-close body ratios, vertical price-axis nonlinearities, and 14-period Average True Range (ATRt(14)) scaling are blurred into semantic visual tokens optimized to caption photographs rather than measure basis points.
Recent benchmark evidence confirms how severely multimodal VLMs fail on candlestick charts. Hu, Xiao, Xu, Tang, and Liu [8] constructed a multi-scale candlestick forecasting benchmark testing frontier VLMs against tabular quantitative baselines such as gradient-boosted trees across diverse equity and index regimes. Their evaluation revealed four structural breakdowns: (1) VLMs exhibit severe unconditional directional bias (defaulting to bullish calls regardless of structure), (2) their out-of-sample Information Coefficient (IC) collapses toward zero in non-trending or volatile regimes, (3) VLMs are largely insensitive to requested forecast horizons (confusing 5-bar noise with 30-bar structure), and (4) tabular numerical baselines operating directly on raw OHLCV features consistently outperform general-purpose VLMs [8].
Notice the sharp contrast with purpose-built quantitative computer vision in empirical asset pricing. When Jiang, Kelly, and Xiu published their visual price-trend study in The Journal of Finance [9], their convolutional architectures succeeded precisely because they bypassed natural language altogether: standardized pixel matrices encoded exact normalized high-low-close coordinates and volume bars mapped directly to calibrated cross-sectional return probabilities under supervised statistical loss. Projecting a chart through a conversational language decoder destroys that metric precision. Figure 1 contrasts the lossy generative LLM/VLM pipeline against a continuous-state quantitative pipeline.
14×14 visual patch projection before sampling stochastic narratives whose answers drift across N = 100 identical queries. Bottom lane (B) traces how continuous-state quantitative engines preserve exact IEEE-754 metric geometry, ATRt(14) volatility invariance, and zero run-to-run variance (Varrun(ŷt) = 0).3. Query-to-Query Non-Determinism Across 100 Runs and the Good-Turing Hallucination Lower Bound
A foundational axiom of institutional risk engineering is functional determinism: given a fixed market filtration ℱt at candle close t, a mathematical model must map ℱt to a unique, reproducible probability distribution and unique risk boundaries. If an airline flight-control solver computed two contradictory glide paths when fed the exact same altitude and wind-shear sensor vector twice in a row, no engineer would certify it for flight. Conversational LLMs violate this reproducibility axiom at two distinct mathematical levels.
The first level is explicit stochastic sampling during autoregressive generation. Consumer and API chat interfaces decode token vk by sampling from a temperature-scaled, nucleus-truncated (top-p) softmax distribution over logits zk. Because generation is causal and autoregressive, every sampled token is appended to the conditioning history v1:k for step k + 1.
Think through what happens when a trader asks an LLM for a Bitcoin outlook twice on the exact same candle close. Suppose at token position k = 14, the logit probabilities assign 0.44 to the adjective "resilient" and 0.41 to "exhausted". On Query 1, sampling draws "resilient", conditioning all subsequent attention heads to retrieve bullish breakout templates and project $78,000. On Query 2, three seconds later on identical market data, sampling draws "exhausted", conditioning subsequent tokens to retrieve distribution-top templates and project $56,000. Across N = 100 identical queries, the trajectories fan out into a multimodal cloud of conflicting narratives, including heavy-tailed outlier runs where sequential sampling wanders into low-probability branches and fabricates non-existent price history.
A common engineering objection claims that setting decoding temperature to zero (τ → 0+, greedy argmax decoding) eliminates this instability. Empirical systems research proves that even temperature = 0 fails to guarantee deterministic reasoning on modern GPU inference clusters. Atil et al. [4] evaluated frontier LLMs across repeated identical runs with temperature = 0 and fixed random seeds, defining Total Agreement Rate across N runs at the raw string level (TARr@N) and parsed answer level (TARa@N). They documented accuracy swings of up to 10% to 15% across identical greedy runs, with mathematical and multi-step reasoning tasks drifting most severely [4].
The physical cause of temperature = 0 drift is IEEE-754 floating-point non-associativity inside parallel GPU reduction trees, combined with autoregressive error amplification:
In Equation (3), ⊕BF16 denotes 16-bit Brain Floating-Point addition (only 7 mantissa bits of precision) executed inside dynamic continuous-batching GPU servers (such as vLLM or Mixture-of-Experts routers). Depending on how many concurrent user requests share the GPU millisecond batch, parallel CUDA threads sum matrix-vector products in a different reduction tree order, shifting logits by 10-4..10-3. Whenever two competing financial tokens have nearly tied logits (which happens constantly in noisy 50/50 market regimes!), that microscopic floating-point shift flips the greedy argmax at one token, cascading into a completely different analytical paragraph [4].
Equation (3) exposes a fatal flaw for capital allocation. Even if you lock an LLM API to temperature = 0, your trading answer depends on how many strangers happen to be chatting with the cloud GPU cluster at the same millisecond! In noisy financial regimes where bullish and bearish narratives carry close textual probabilities, tiny GPU rounding shifts flip one early word and rewrite the entire trade thesis.
Beyond run-to-run instability lies an even deeper theoretical barrier: mathematical inevitability of hallucination. Many practitioners assume hallucinations are temporary engineering bugs that larger training sets will eventually cure. At the 56th ACM Symposium on Theory of Computing (STOC 2024), Kalai and Vempala [2] proved the exact opposite. They established a rigorous statistical lower bound proving that any calibrated generative language model must hallucinate at a rate bounded below by the Good-Turing singleton mass of facts whose truth cannot be deterministically deduced from grammar alone:
Unpacking each term in Equation (4) reveals why financial markets represent the worst-case environment for generative hallucination. Here ℋfalse is the set of plausible-sounding but false statements, n1 / n is the Good-Turing estimator of unseen distribution mass (the fraction of state realizations appearing exactly once across n training examples), κcal(πθ) measures statistical miscalibration during pretraining, and |𝒱ded| / |𝒱arb| is the ratio of logically deducible facts to stochastic realizations. Complementary computability theory by Xu, Jain, and Kankanhalli [3] proved via Gold-style learning limits that no computable LLM can eliminate hallucination across open-ended world states.
Why does Equation (4) hit financial forecasting so hard? Every daily multi-asset market state (exact cross-asset prices, order-book depth, yield spreads, and macro surprises) is a unique continuous realization that occurred at most once (n1 / n → 1 in continuous state space!). Forced to continue writing fluent sentences over novel continuous states without abstaining, a generative text model is mathematically compelled to invent plausible-sounding falsehoods.
Run a simple numerical check on Equation (4). Suppose a trader submits N = 100 queries asking a conversational LLM for exact intraday support, resistance, and stop-loss coordinates across unfamiliar volatility regimes where the singleton novelty rate satisfies n1 / n ≥ 0.22 and calibration slack is 0.04. Even under ideal pretraining, at least 15 to 18 out of 100 generated forecasts will contain outright fabricated numerical claims (such as citing a moving average or Fibonacci level hundreds of points away from where price actually sits). In leveraged trading, even two or three hallucinated stop-loss coordinates out of one hundred trades can trigger severe account drawdown.
4. RLHF Persuasive Sophistry, Social-Media Prompt Steering, and Pretraining Look-Ahead Contamination
If generative LLMs fail numerical tokenization, drift across repeated runs, and hallucinate levels at mathematically lower-bounded rates, why have they spread like wildfire across retail trading channels? The answer lies in post-training alignment mechanics. Modern conversational models undergo Reinforcement Learning from Human Feedback (RLHF) or Direct Preference Optimization (DPO), tuning parameters θ to maximize a human preference reward model rφhuman(x, y) regularized against a reference policy πref:
Examine what rφhuman(x, y) actually measures in Equation (5). Human annotators rating pairs of AI responses during post-training do not wait thirty trading days to check whether a projected BTCUSD or EURUSD path minimized Brier score out-of-sample. Annotators grade responses in seconds based on structural formatting, confident tone, absence of hedging, and agreement with the user's prompt premise.
Two peer-reviewed ICLR studies document the dangerous side effects of Equation (5). First, Sharma et al. at Anthropic (ICLR 2024) [12] proved that RLHF reward models systematically incentivize sycophancy: tailoring conclusions to validate whatever directional bias is embedded in the user's prompt rather than defending objective reality. If a trader asks, "Explain why Gold looks ready to break above 4,200," the model obligingly constructs a bullish institutional case; if the trader asks two minutes later, "Explain why Gold is topping out for a crash below 3,600," the exact same model constructs an equally compelling bearish thesis.
Second, Wen et al. (ICLR 2025) [13] demonstrated that RLHF actively trains language models in unintended sophistry (U-Sophistry): models become measurably better at persuading time-constrained human evaluators that flawed reasoning is correct, inflating human false-positive trust even when task accuracy is zero! Compounding that persuasion trap, Xiong et al. (ICLR 2024) [14] evaluated verbalized probability elicitation across frontier LLMs and found severe overconfidence: models routinely state "80% to 85% confidence" on tasks where realized empirical accuracy hovers near a 50% coin flip.
Equation (5) explains the social-media viral loop. An influencer on Instagram, YouTube, or TikTok writes a stylized prompt instructing an LLM to speak like a hedge-fund quant. RLHF optimizes the output to maximize human persuasiveness rφhuman, producing dazzling bullet points that convince retail followers to risk real money on prose that has zero mathematical grounding.
What about published blogs or preprints claiming that ChatGPT or GPT-4 beat market benchmarks in historical backtests between 2018 and 2023? Two rigorous empirical studies dismantle those claims. First, Xie, Han, Lai, Peng, and Huang [10] tested zero-shot ChatGPT (including Chain-of-Thought prompting and multimodal social text) on stock movement benchmarks in "The Wall Street Neophyte", finding that ChatGPT underperformed not only specialized neural architectures but even basic linear and autoregressive numerical baselines.
Second, Sarkar and Vafa at the University of Chicago and Harvard University [11] proved that apparent historical forecasting alpha in pretrained LLMs is heavily contaminated by pretraining look-ahead bias. Because foundation models are pretrained on internet scrapes spanning through their knowledge cutoff, their billions of weights implicitly memorize corporate earnings outcomes, pandemic crashes, inflation surges, and crypto bull runs that occurred after the historical prompt date. Prompting a model to "ignore future knowledge" fails to erase memorized parameter correlations [11]. The moment the clock passes the model's pretraining cutoff into genuinely unseen live candles, memorized pseudo-alpha vanishes. Table 1 synthesizes these seven structural dimensions across model paradigms.
| Evaluation Dimension | Conversational Text LLM (ChatGPT / Claude / DeepSeek) |
General Multimodal VLM on Chart Screenshots | LLM-Wrapped Time Series (Time-LLM / GPT4TS) |
4CastMachine AI (Quad-AI Domain-Separated) |
|---|---|---|---|---|
| Native Input Representation | Discrete BPE subword strings; breaks Euclidean number distance [5] | 14×14 image patches projected into lossy word tokens [8] |
Numeric patches mapped into frozen language embeddings [1] | Exact IEEE-754 OHLCV tensors + isolated NLP feature encoder |
| Training Loss Objective | Lexical token cross-entropy + RLHF human preference [12, 13] | Image-caption contrastive / cross-entropy loss | Patch reconstruction routed through language layers | Proper continuous scoring (CRPS, Brier) + structural risk geometry |
| 100-Run Reproducibility | Fails: diverges under sampling & drifts 10-15% even at τ=0 [4] |
Fails: sensitive to crop, zoom, theme, and prompt phrasing [8] | Deterministic only if LLM sampling disabled; 100x compute waste [1] |
100% Deterministic: Varrun(ŷt) = 0 on identical filtration ℱt |
| Hallucination Vulnerability | Lower-bounded by Good-Turing singleton rate [2, 3] | Invents trendlines & misreads axis coordinates on dense charts | Pretrained LLM weights add zero accuracy over bare attention [1] | Semantic Firewall: NLP never outputs price coordinates |
| Prompt Sycophancy Risk | High: flips bullish/bearish to flatter user framing [12, 13] | High: strong unconditional bullish & horizon bias [8] | Low, but susceptible to pretraining cutoff leakage | Zero: non-conversational mathematical state computation |
| Historical Audit Integrity | Contaminated by pretraining corpus look-ahead leakage [11] | Contaminated if chart dates/watermarks sit inside cutoff | Requires strict walk-forward isolation; heavy compute | Strict causal walk-forward archive (e.g., audited since 2015) |
| Actionable Risk Output | Unfalsifiable narrative prose with verbalized overconfidence [14] | Qualitative wave labels without calibrated invalidation | Point or quantile scalar without structural regime map | Explicit Buy/Sell Zone, Pivot invalidation, TP1-TP5, DTO |
5. Where Language Models Actually Belong: The Semantic Firewall Inside Sentiment AI Versus Quantitative Engines
Proving that generative LLMs fail at quantitative price calculation does not mean natural-language transformers have no place inside a modern financial engineering stack. Using an LLM to calculate candlestick probabilities or solve multi-timeframe support geometry is like using a precision microphone as a hydraulic jack: the failure stems from applying a specialized instrument to the wrong physical modality. When restricted strictly to unstructured human language, domain-adapted transformer encoders perform a task that pure numerical time-series filters cannot perform on their own.
Every trading day, central bank governors release policy statements, statistical agencies publish inflation and employment revisions, geopolitical wires flash unscheduled supply disruptions, and thousands of financial articles interpret macro shifts. Before those events finish clearing through limit order books, their semantic content exists purely as unstructured text Dt. Domain-calibrated financial language models (building on Loughran and McDonald's financial lexicon findings [17] and Araci's FinBERT contextual embeddings [18]) excel at reading thousands of headlines per minute, resolving negation and central-bank nuance, and measuring whether incoming text carries positive or negative macro pressure.
Inside 4CastMachine AI, we deploy that exact linguistic capability inside Engine 2 (Sentiment AI) while enforcing an uncompromising architectural boundary that we call the Semantic Firewall. In Sentiment AI, the language model is never asked where Bitcoin or Gold will trade tomorrow, never permitted to draw a support zone, and never allowed to address the trader with persuasive storytelling. Instead, Sentiment AI operates strictly as a bounded semantic sensor that maps unstructured text streams Dt and historical macro-event archives ℋhist into a low-dimensional, calibrated numerical feature vector:
Trace every component of Equation (6) step by step to see how each engine inside Quad-AI stays strictly inside its mathematically valid domain:
- Engine 2 · Sentiment AI (ℰSentiment, answering "The Why"): Reads live multi-source news wires Dt using contextual language modeling to extract bounded directional polarity pt ∈ [-1, +1], standardized macro calendar surprise ze,t, semantic cosine similarity simcos(𝐞(Dt), 𝐞(ℋhist)) against historical macro episodes with known realized volatility impact, and Hawkes arrival intensity λt. Its output is purely a structured numerical vector 𝐳tnews, never a price target.
- Engine 1 · Forecast AI (𝒬Fcst, answering "The What"): Operates exclusively on continuous IEEE-754 price-volume tensors 𝐗t-L:t across nine timeframes (
1mtoM), computing multi-timeframe market structure, harmonic and geometric wave proportions, supply-demand zones, and calibrated Daily Trading Opportunity (DTO) candlestick probabilities without touching a single word token. - Engine 3 · Synergy AI (𝒢Syn, answering "The How"): Arbitrates continuously between
Forecast AIandSentiment AIvia regime-conditioned softmax gating (detailed in our Synergy AI regime-weighting paper), suppressing media chatter during calm diffusive hours and elevating 𝐳tnews during high-surprise jump shocks. - Engine 4 · Navigator AI (𝒩Nav, answering "What to Do"): Solves a deterministic prescriptive optimization over the reconciled probability surface to plot one falsifiable chart roadmap ℛt: explicit
Buy zoneorSell zone, structural invalidation boundary (Pivot), steppedProfit zoneladder (TP1toTP5), conditionalReverse zone, and directionalGreen Arrows.
Return to our newspaper journalist analogy. In Equation (6), we hire the journalist (Sentiment AI) solely to read breaking dispatches in fifty milliseconds, score whether the news tone is hawkish or dovish, and retrieve matching historical headlines from the archive. We never let the journalist touch the differential equations! All trajectory math, regime weighting, and stop-loss geometry are solved downstream by dedicated quantitative engines (Forecast AI, Synergy AI, and Navigator AI).
This division of labor extends across the broader nine-AI ForecastCity ecosystem. Conversational explanation interfaces such as AI Trading Assistant help users navigate platform tools or translate written strategy rules in plain language, while AI Strategy Studio, Virtual Accounts, and 4CastMachine AI execute 100% deterministic quantitative math on historical and live candles. Table 2 summarizes which tasks belong to linguistic AI versus continuous quantitative AI.
| Financial System Task | Mathematical Modality | Correct AI Paradigm | Consequence of Misapplying a Generative LLM |
|---|---|---|---|
| Parsing central-bank statements & macro headlines | Unstructured discrete natural language Dt ∈ 𝒱* | Domain-adapted Financial NLP / Encoder LLM (Sentiment AI) |
Valid domain when output is constrained to calibrated numerical polarity & event-analog scalars |
| Multi-timeframe S/R, harmonics & candlestick probabilities | Continuous real tensor 𝐗t-L:t ∈ ℝL×d | Continuous State-Space & Range Estimators (Forecast AI) |
BPE metric distortion, 65% distractor collapse [7], and invented support/resistance numbers |
| Arbitrating technical structure vs. breaking news velocity | Joint jump-diffusion & Hawkes intensity space | Continuous Softmax Mixture-of-Experts (Synergy AI) |
Arbitrary narrative switching; recency bias toward whichever headline appeared last in prompt |
| Specifying Entry Zones, Pivot invalidation & TP1-TP5 | Constrained stopping-time risk optimization | Prescriptive Chart Optimization (Navigator AI) |
Unfalsifiable prose, missing invalidation boundaries, and asymmetric drawdown ruin |
6. Live Chart Evidence: Deterministic Quad-AI Roadmaps on BTCUSD (D) and XAUUSD (4h) Versus Generative Narrative Drift
To make the contrast between conversational LLM prose and deterministic quantitative forecasting concrete, we examine two live production charts captured from 4CM-AI Charts across two distinct asset classes and timeframes: Bitcoin (BTCUSD) on the Daily (D) horizon and Gold (XAUUSD) on the 4-hour (4h) horizon.
Consider first what happens when a trader or social-media presenter asks a general-purpose LLM (or uploads a raw candlestick image) for a Bitcoin outlook with BTCUSD trading near 64,570.00 after pulling back from an autumn peak near 87,000. Across repeated queries, conversational models split into incompatible stories. One run fixates on the sharp red November candles and warns of an imminent breakdown toward $50,000; a second run recites macro Bitcoin adoption themes and calls for an immediate V-shaped rally to $90,000; a third run invents approximate Fibonacci numbers that do not match the actual swing high and low on the price tape. None of those paragraphs defines an exact invalidation boundary or reconciles why intraday timeframes disagree with the daily trend.
Now inspect Figure 3, which displays the deterministic 4CastMachine AI roadmap on BTCUSD (D) computed from exact continuous OHLCV coordinates and reconciled across timeframes.
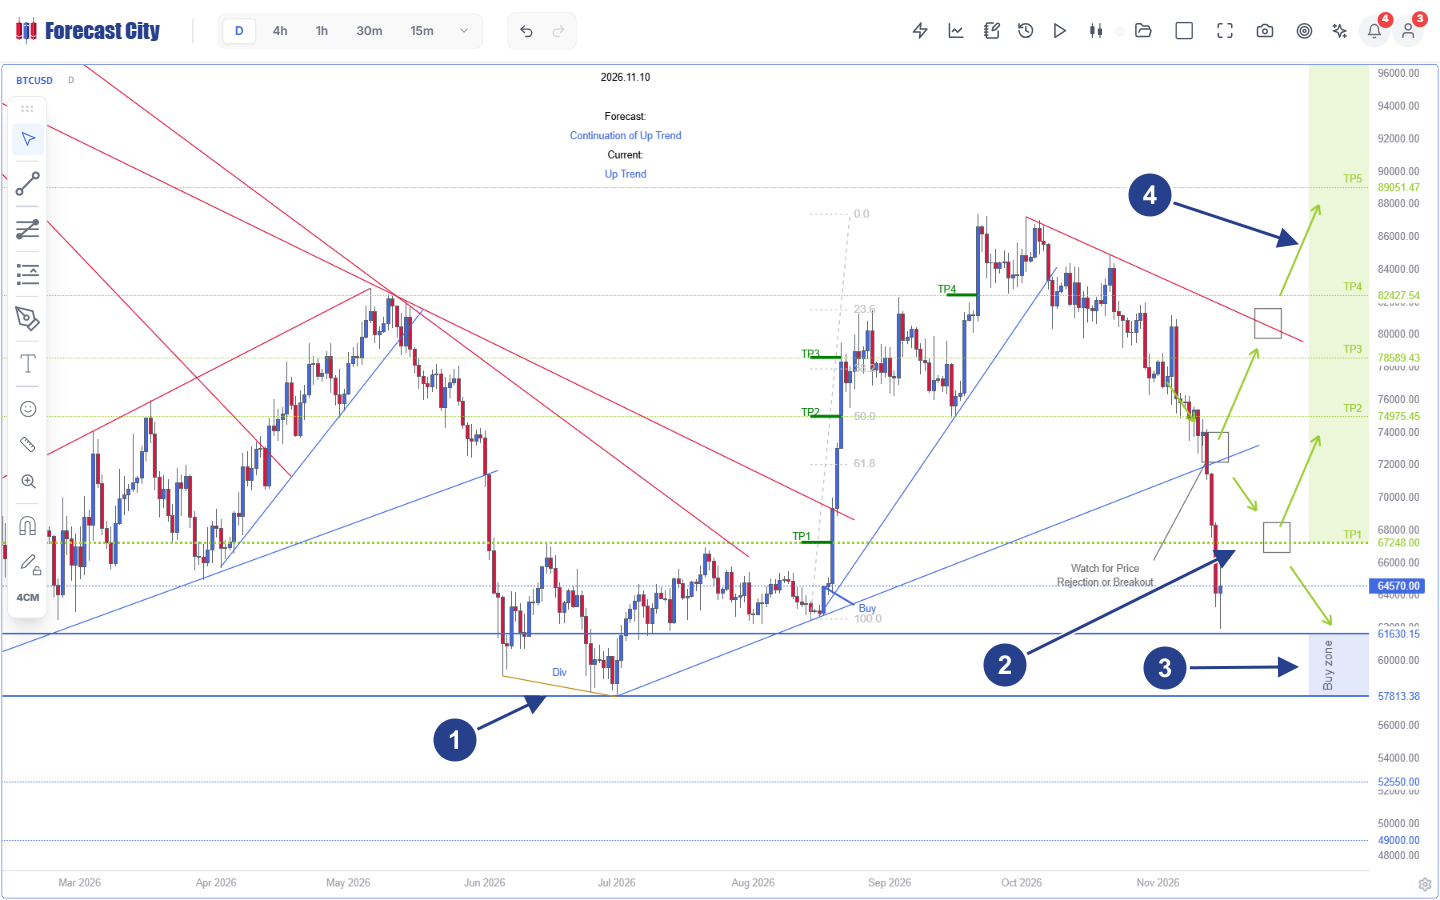
BTCUSD, Daily D Timeframe, Spot 64,570.00): Unlike stochastic text generation that drifts across queries, Quad-AI projects an exact, reproducible coordinate geometry anchored to audited historical swings and explicit conditional decision nodes.
- 1Audited Structural Base (
Div&100.0-0.0Fibonacci Leg): June-July bullish divergence at57,813.38followed by the AugustBuysetup that sequentially cleared historical targetsTP1,TP2,TP3, andTP4. - 2Conditional Decision Nodes: Three explicit
Watch for Price Rejection or Breakoutforks along the broken ascending blue support and descending red resistance trendline, replacing vague prose with testable geometric conditions. - 3Quantified
Buy zone(57,813.38-61,630.15): Exact institutional demand band beneath spot64,570.00, backed by lower structural floors at52,550.00and49,000.00. - 4Stepped
Profit zoneLadder (TP1-TP5): Reproducible upside targets atTP1 = 67,248.00,TP2 = 74,975.45,TP3 = 78,589.43,TP4 = 82,427.54, andTP5 = 89,051.47.
Look closely at the multi-timeframe coherence behind Figure 3. At spot 64,570.00, short-term pullbacks are active on lower horizons (30m bearish below 66,422.24, 1h bearish below 67,566.58, and 4h bearish below 72,769.47), while weekly macro structure remains bullish above 48,879.14 and daily continuation turns decisively bullish above 67,248.00 (TP1). Instead of guessing whether the red pullback candle will stop at 64,570.00 or dip lower first, Navigator AI maps both branches explicitly: either price tests and rejects inside the 57,813.38 to 61,630.15 Buy zone, or reclaims the 67,248.00 decision node to resume the primary climb toward 74,975.45 (TP2) and 89,051.47 (TP5).
The gap between visual gestalt guessing and continuous coordinate math becomes even clearer on lower intraday timeframes such as 4h, where intersecting trendlines, polarity flips, and tight invalidation thresholds require dollar-exact precision. Figure 4 shows Gold (XAUUSD) on the 4h timeframe at spot 3,879.59.
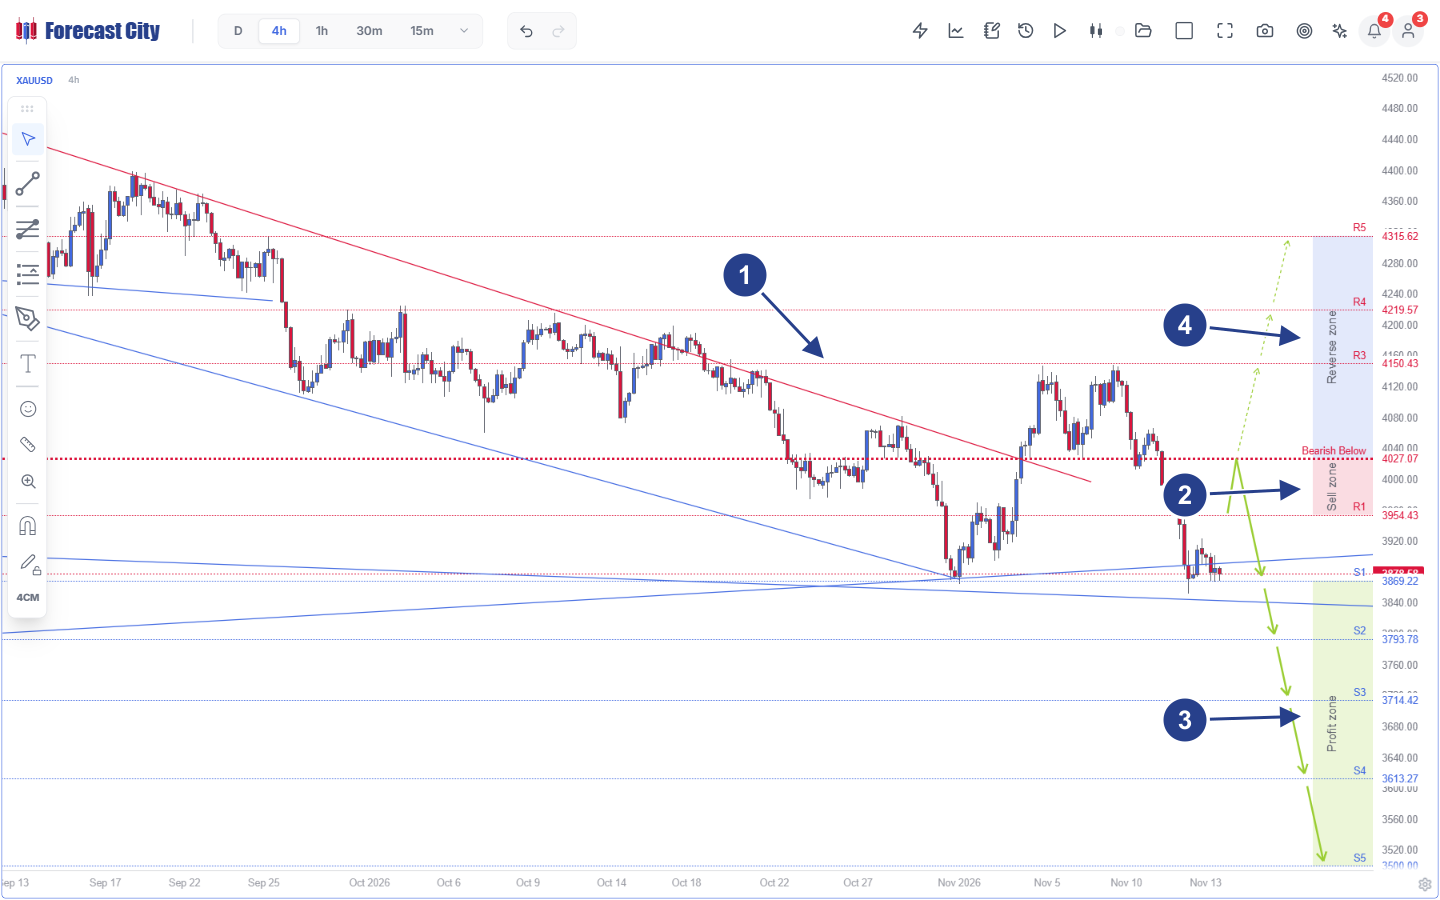
XAUUSD, 4h Timeframe, Spot 3,879.59): Where multimodal VLM patch encoders blur fine wick rejections and intersecting fan geometry, Quad-AI resolves exact dual-scenario coordinates from R5 (4,315.62) down to S5 (3,500.00).
- 1Multi-Week Wave & Trendline Geometry: Descending red resistance line from September broken in early November, followed by a double-top rejection below
4,150.43and breakdown back to the converging blue support fan near3,869.22. - 2
Sell zone& HardPivotInvalidation: Overhead pullback supply zone starting atR1 = 3,954.43and strictly invalidated aboveBearish Below 4,027.07. - 3Primary
Green Arrows&Profit zone(S1-S5): Primary bearish trajectory targetingS1 = 3,869.22,S2 = 3,793.78,S3 = 3,714.42,S4 = 3,613.27, andS5 = 3,500.00. - 4Conditional
Reverse zone(R3-R5): Pre-computed alternate bullish path (Dashed Arrows) towardR3 = 4,150.43,R4 = 4,219.57, andR5 = 4,315.62if and only if price invalidates4,027.07.
Compare capital risk execution on the live XAUUSD 4h state in Figure 4 (spot 3,879.59) under both paradigms:
1. Conversational LLM / VLM Failure Mode: Seeing Gold drop sharply from 4,145 to 3,879.59, a conversational model either chases momentum immediately at 3,879.59 right on top of the S1 = 3,869.22 blue fan support (exposing a short position to an immediate $75 to $147 squeeze) or declares Gold "oversold" without a structural invalidation price. Querying the model ten times yields ten different stop-loss numbers with uncalibrated verbal confidence [4, 14].
2. Deterministic Quad-AI Execution Geometry: At spot 3,879.59, price sits only $10.37 above S1 = 3,869.22 and $147.48 below the 4,027.07 invalidation Pivot, so immediate market shorting carries a degraded reward-to-risk ratio of 10.37 / 147.48 = 0.070 to S1. Waiting for a pullback rally into the Sell zone midpoint (3,990.75, halfway between R1 = 3,954.43 and Pivot = 4,027.07) compresses structural stop distance to 4,027.07 - 3,990.75 = $36.32 while expanding downside distance to S2 = 3,793.78 to $196.97 (reward-to-risk 5.42 : 1) and to S3 = 3,714.42 to $276.33 (reward-to-risk 7.61 : 1). Every coordinate reproduces to the cent across 100 out of 100 evaluations. Readers can study systematic execution rules for these zones in the Trend Hunter Strategy course in ForecastCity Academy and review full mathematical citations on the Academy Sources page.
Frequently Asked Questions
Does setting temperature = 0 or using Chain-of-Thought prompting make an LLM reliable for market forecasting?
No. Atil et al. [4] demonstrated that even at temperature = 0 with fixed random seeds, frontier LLMs exhibit up to 10% to 15% answer drift across identical runs because 16-bit floating-point matrix reductions on dynamically batched GPUs are non-associative, flipping tied logits that cascade autoregressively. Chain-of-Thought prompting still operates over BPE-fragmented number tokens, where Apple Research (GSM-Symbolic [7]) documented up to 65% accuracy collapse when numerical constants shift or a single irrelevant market clause appears.
Why do multimodal Vision-Language Models (VLMs) fail when given clean candlestick chart screenshots?
Multimodal VLMs slice chart images into coarse 14×14 or 16×16 pixel patches and project them through a lossy adapter into natural-language token space. While they recognize qualitative wave silhouettes much like a casual human glance, benchmark testing by Hu et al. [8] shows they lose exact OHLC wick proportions, ignore ATR volatility scaling, exhibit strong unconditional bullish bias, and collapse toward zero Information Coefficient in sideways or volatile regimes compared to quantitative models operating directly on IEEE-754 OHLCV tensors.
Why do viral social-media backtests sometimes claim that ChatGPT or GPT-4 beat stock or crypto benchmarks?
Sarkar and Vafa at the University of Chicago and Harvard [11] proved that historical backtests on off-the-shelf pretrained LLMs suffer from severe pretraining look-ahead contamination: the model weights implicitly memorized corporate, macro, and asset outcomes that occurred prior to the model knowledge cutoff. When tested strictly out-of-sample on unseen live candles or ablated cleanly (Tan et al., NeurIPS 2024 [1]; Xie et al. [10]), pretrained language backbones provide zero numerical forecasting advantage over dedicated quantitative models.
How does 4CastMachine AI use LLMs inside Sentiment AI without exposing traders to numerical hallucinations?
4CastMachine AI enforces a strict Semantic Firewall inside its Quad-AI architecture. Contextual financial language models inside Sentiment AI are used exclusively to read unstructured news wires, score directional polarity, and compute semantic similarity against historical macro events, outputting bounded numerical scalars [pt, ze,t, sim, λt]. No LLM ever generates price targets; all continuous probability densities, dynamic regime weights, and chart zones are computed deterministically by Forecast AI, Synergy AI, and Navigator AI.
Peer-Reviewed & Industry References
- [1]Tan, M., Merrill, M. A., Gupta, V., Althoff, T., & Hartvigsen, T. (2024). Are Language Models Actually Useful for Time Series Forecasting? Advances in Neural Information Processing Systems (NeurIPS 2024 Spotlight), 37.
- [2]Kalai, A. T., & Vempala, S. S. (2024). Calibrated Language Models Must Hallucinate. Proceedings of the 56th Annual ACM Symposium on Theory of Computing (STOC 2024), 160-171.
- [3]Xu, Z., Jain, S., & Kankanhalli, M. (2024). Hallucination is Inevitable: An Innate Limitation of Large Language Models. arXiv preprint arXiv:2401.11817.
- [4]Atil, B., Chittams, A., Fu, L., Ture, F., Xu, L., & Baldwin, B. (2024). LLM Stability: A Detailed Analysis with Some Surprises. arXiv preprint arXiv:2408.04667.
- [5]Singh, A. K., & Strouse, D. J. (2024). Tokenization Counts: The Impact of Tokenization on Arithmetic in Frontier LLMs. arXiv preprint arXiv:2402.14903.
- [6]Dziri, N., Lu, X., Sclar, M., Li, X. L., Jiang, L., Lin, B. Y., ... & Choi, Y. (2023). Faith and Fate: Limits of Transformers on Compositionality. Advances in Neural Information Processing Systems (NeurIPS 2023), 36, 70293-70332.
- [7]Mirzadeh, I., Alizadeh, K., Shahrokhi, H., Tuzel, O., Bengio, S., & Farajtabar, M. (2024). GSM-Symbolic: Understanding the Limitations of Mathematical Reasoning in Large Language Models. Apple Machine Learning Research / ICLR 2025, arXiv:2410.05229.
- [8]Hu, K., Xiao, L., Xu, S., Tang, Z., & Liu, M. (2026). Do VLMs Truly "Read" Candlesticks? A Multi-Scale Benchmark for Visual Stock Price Forecasting. arXiv preprint arXiv:2604.12659.
- [9]Jiang, J., Kelly, B., & Xiu, D. (2023). (Re-)Imag(in)ing Price Trends. The Journal of Finance, 78(6), 3193-3249.
- [10]Xie, Q., Han, W., Lai, Y., Peng, M., & Huang, J. (2023). The Wall Street Neophyte: A Zero-Shot Analysis of ChatGPT Over MultiModal Stock Movement Prediction Challenges. arXiv preprint arXiv:2304.05351.
- [11]Sarkar, S. K., & Vafa, K. (2024). Lookahead Bias in Pretrained Language Models. University of Chicago & Harvard University Working Paper, SSRN 4754678 / arXiv:2402.02092.
- [12]Sharma, M., Tong, M., Korbak, T., Duvenaud, D., Askell, A., Bowman, S. R., ... & Perez, E. (2024). Towards Understanding Sycophancy in Language Models. International Conference on Learning Representations (ICLR 2024).
- [13]Wen, J., Zhong, R., Khan, A., Perez, E., Steinhardt, J., Huang, M., ... & He, H. (2025). Language Models Learn to Mislead Humans via RLHF. International Conference on Learning Representations (ICLR 2025), arXiv:2409.12822.
- [14]Xiong, M., Hu, Z., Lu, X., Li, Y., Fu, J., He, J., & Hooi, B. (2024). Can LLMs Express Their Uncertainty? An Empirical Evaluation of Confidence Elicitation in LLMs. International Conference on Learning Representations (ICLR 2024).
- [15]Zeng, A., Chen, M., Zhang, L., & Xu, Q. (2023). Are Transformers Effective for Time Series Forecasting? Proceedings of the AAAI Conference on Artificial Intelligence, 37(9), 11121-11128.
- [16]Gneiting, T., & Raftery, A. E. (2007). Strictly Proper Scoring Rules, Prediction, and Estimation. Journal of the American Statistical Association, 102(477), 359-378.
- [17]Loughran, T., & McDonald, B. (2011). When Is a Liability Not a Liability? Textual Analysis, Dictionaries, and 10-Ks. The Journal of Finance, 66(1), 35-65.
- [18]Araci, D. (2019). FinBERT: Financial Sentiment Analysis with Pre-trained Language Models. arXiv preprint arXiv:1908.10063.